
How do you react to data from your manufacturing plant?
A part of my job that I really enjoy is seeing the reaction of customers seeing their first live data come in. There’s usually an immediate comment like, ‘why is that not running?’ They may get on the phone and ask someone to explain what’s going on. It’s a natural reaction, you get excited about the new possibilities.
But if picking up the phone and asking (or ordering) people around is your main strategy, you’re an over-reactor.
For every over-reactor, there’s going to be an under-reactor too. Despite months or years of data that’s telling a very clear story, they seem un-moved. There’s no reaction.
Or perhaps you’ll identify with the pattern of the flip flop person. Months of inaction followed by a frustrated flurry of over-reaction. “The boss is on the war-path”.
This blog article will introduce a tool that will help anyone develop more consistent and appropriate reactions to data. An essentially skill for data-driven managers and evidence-based leaders.
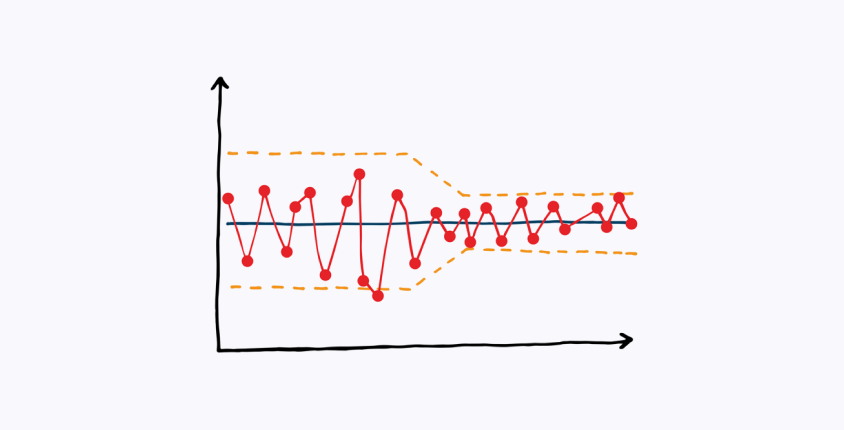
The Shewhart Chart
The tool that will really help you is called the Shewhart chart, sometimes called a run chart or XmR chart. Shewhart charts are named after Walter A. Shewhart, an American physicist, engineer and statistician. Shewhart pioneered thinking about industrial quality, in particular, the idea that looking at process variation is just as, if not more important than final results.
He thought about how to analyse and categorise different types of variation. And this is where his chart excels, it’s great for telling apart two fundamentally different types of variation. These are common cause variation and special cause variation.
Like gravity, common cause variation it just a fact of life. It always there in any process of machine. Special cause variation on the other hand is, wait for it, a statistically significant change. Examples include a loss of calibration in a machine, a change to a supplier of raw material, or even a change to a key staff member.
You might see where I’m going with this.
‘Don’t over-react to common cause variation, don’t under-react to special cause variation.’
Let me be clear, do observe and measure both types. Do reflect on them. But learn to identify what kind of variation you’re dealing with. Then calculate your response based on that.
Building a Shewhart Chart in Excel
Let’s get to the practical stuff. What does a Shewhart chart look like and how to you build one? If you want to have a go with Excel and have some data to use, check out this link to Stacy Barr’s post. As a side note, her book Prove It – How to Build A High-Performance Culture and Measure Success has good further reading on this topic. Specifically, check out chapter 7 and Appendix A.
A Shewhart Chart for a real operation
To let us see a real world example, real data based on one of DataNow’s New Zealand quarry customers was plotted . The customer was asking the question “what progress have we made on our production speed over the years”. The Shewhart chart is perfect for answering this kind of question.
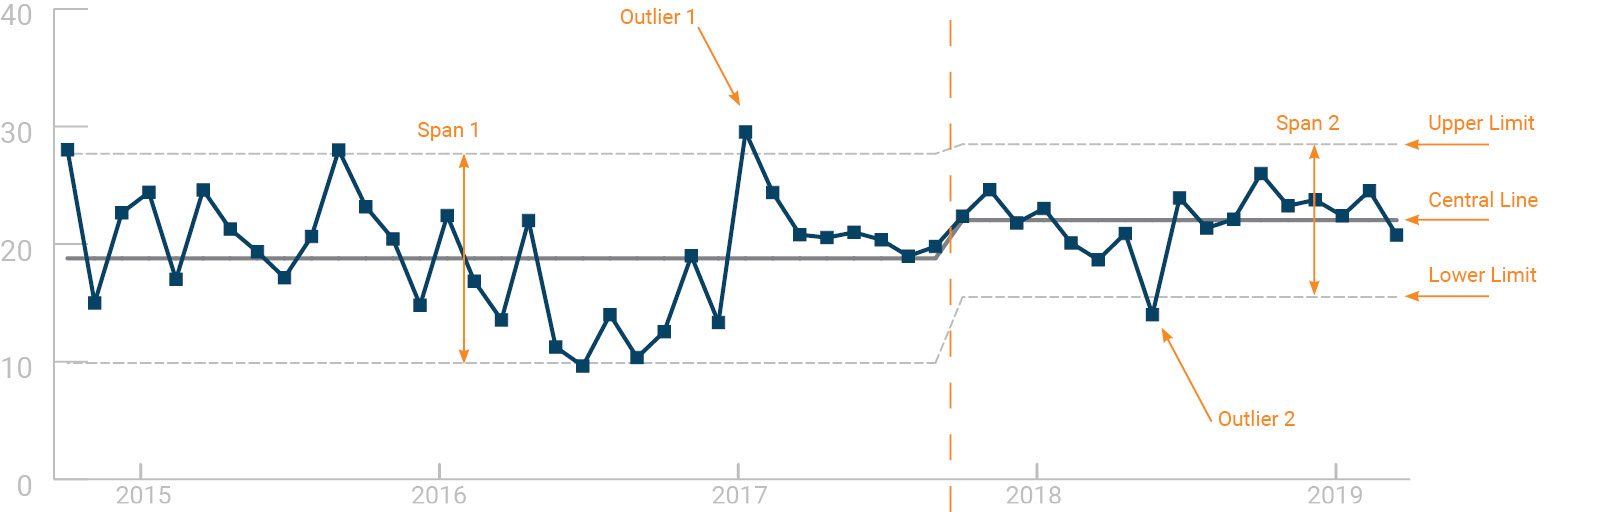
Firstly, we can see that from 2015 to mid-2017, there was significant variation in speed performance. That is, there was a lot of common cause variation. This is quantified by wide upper and lower limit lines, which I’ve labelled Span 1.
Secondly, we can see that there are some values outside the limit lines, which I’ve labelled outliers. While they look bad (or good) it’s important to note that they do not indicate any special cause change. Something happened, but evidence after that time shows that the issue didn’t persist, so we should caution any reactions we may have.
Finally, we can observe a change occurring from mid 2017. At that time, we start to get several successive points above the central line. This means, something has changed beyond common cause variation. From that point onward, I recalculated the central and limit lines. A new state of ‘normal’ has been reached and you have proof of it. You are going faster with less variation.
Story telling using your chart
What we’ve done above is to tell a data-driven story of what happened at a real quarry. The Shewhart chart helps you to extract the main plot from all of the twists, turns and anecdotes along the way.
The main story points are picked up directly from the different components of the chart. These components are:
- The value of the central line.
- The size of your process limits (common cause variation).
- The commentary on outliers.
- The commentary on special cause variations.